SaaS - Service Design
Software Product House
Background
This company develops enterprise insurance software, and had an existing suite of highly successful on-premise hosted admin and web applications, both internal and consumer-facing. With this project, the company wanted to develop a next-generation SaaS product aimed at providing cutting-edge digital experiences, enabling new capabilities for insurers and new possibilities for the consumer. I was the design lead for the first journeys to be built - quote-and-buy, account management and claims. Though this section is purely about the Service Design efforts for this project, I also worked on the planning, research and front-end design.
Before work started we first needed to set some strategy around what we were trying to do. We needed to answer questions around scope for this new SaaS platform, who exactly it was going to provide value for, and why.
What I Did
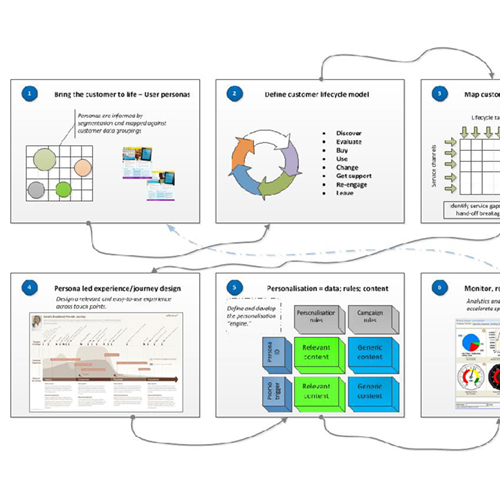
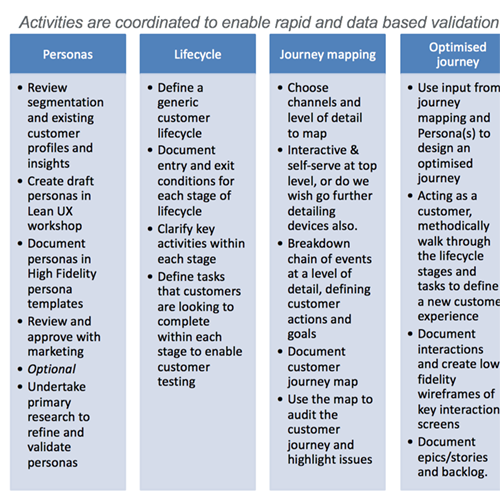
At the early stages of strategy-setting, Service Design thinking and methods provided invaluable structure and direction. Working closely with Product Management, to start with I created a high-level action plan for how a user-centric, data-informed model for design and development might look. The idea being that a solid user-centered design process would be used to define the first optimized journeys, with these subsequently iterated and improved upon based on analytics and continuous learning. For each of the stages I made suggestions for activities to be undertaken, and what resources woud be needed. The last piece - resourcing - was key in getting buy-in from management, as the people controlling the spend had a traditional "engineering-led" mindset. Making design-led efforts quantifiable, and having measurable goals helped to allay concerns in trying something "new".
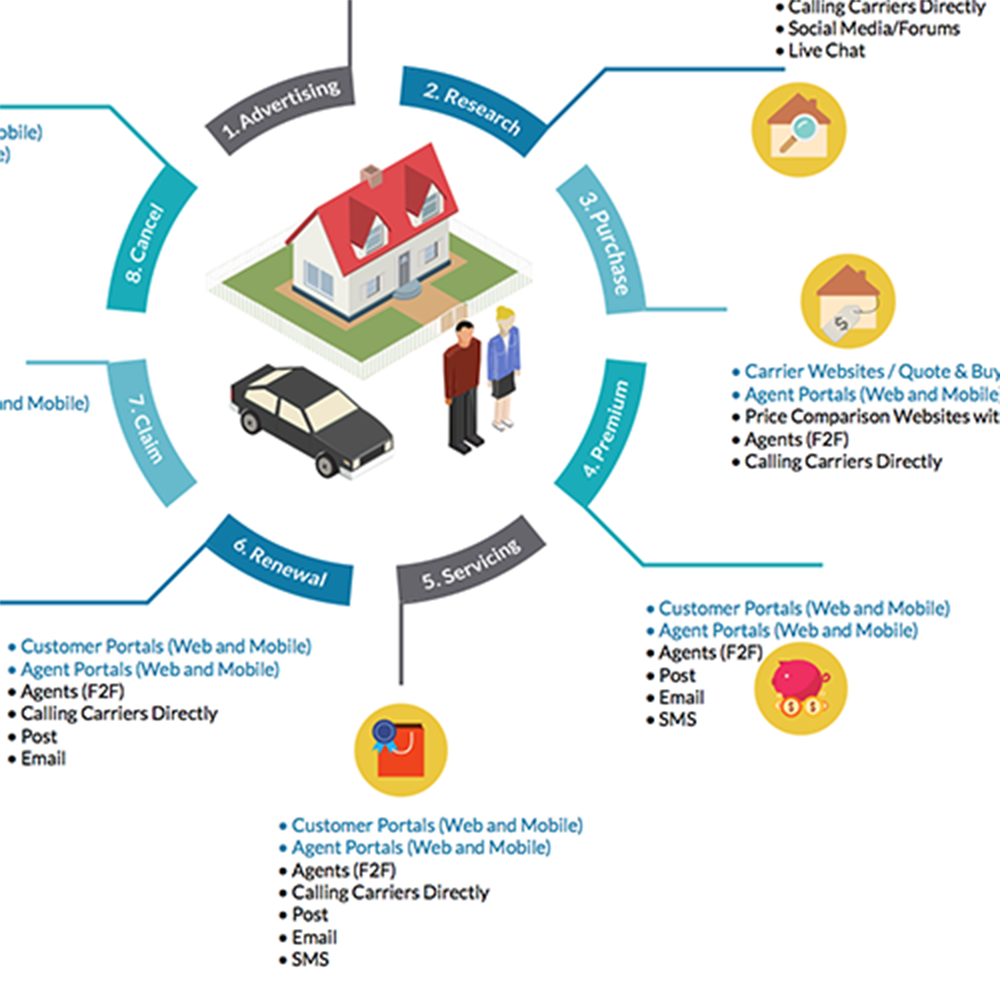
Once agreement was given to go ahead, the first part of the plan was refining our thinking about the parts of the customer lifecycle our software would impact. To illustrate thinking about how the lifecycle could/should be broken down into phases, what touchpoints and channels might be involved at each phase etc., I created a diagram in Illustrator. With this as a tool, the steering group was able to adjust scope as to what stages we would cover, roughly consider what functional "blocks" would be encompassed, and give first thought to how specific channels would be accommodated.
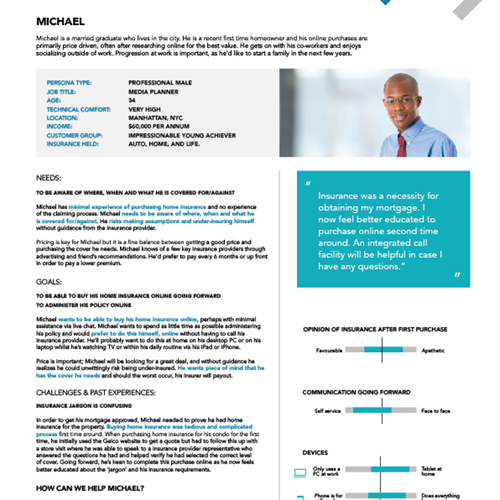
The next step was to define who we were going to be building for through research (I talk about the fine-grained research activities elsewhere). Effective research was especially important bearing in mind that we were to develop a SaaS - a configurable, "one-size-fits-most" solution that we would deliver to our clients, that they in turn would expose to their customers. We needed to optimize for our clients' customers. With this in mind, a number of key segments were identified as especially important to the industry (such as millennials), so we concentrated our efforts accordingly.
One of the outputs from research was a series of refined personas. I used these artifacts to guide journey-mapping workshops with the Product Management team and other stakeholders, where the personas served to focus discussion and prevent decisions from being made on a self-referential basis. In these workshops we walked our personas through the journeys that we were building for, identifying pain-points and oppotunities for optimization.
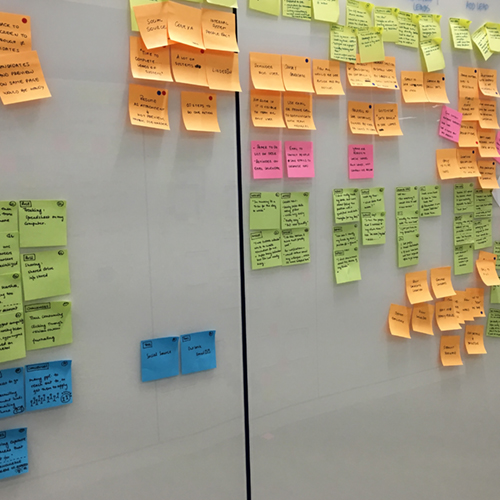
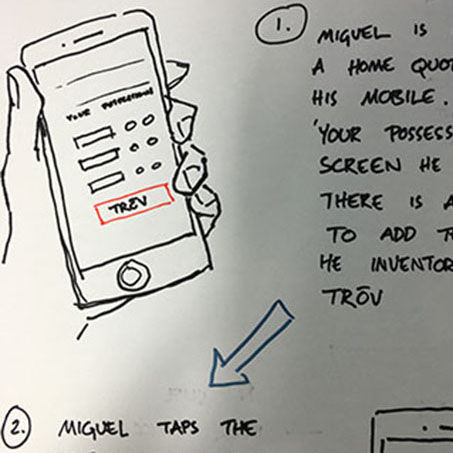
Following journey-mapping workshops, pain-points and opportunities were documented and elaborated on in subsequent sessions to brainstorm ideas. Here as a group we sketched out scenarios and storyboards for flows, looked at channel strengths for specific interactions (mobile) and how "smart" integrations with third party services might improve journeys.
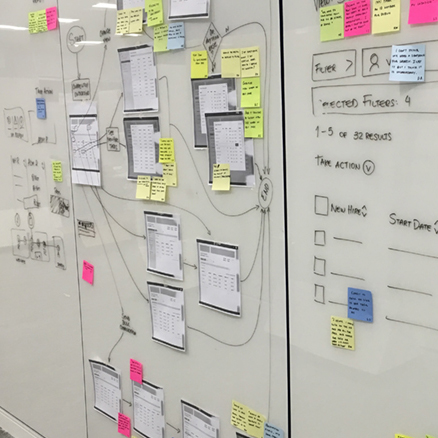
At this point the good thing was that we had a set of optimized journeys that had been expanded to take in a huge amount of detail. The bad thing was that managing this information was proving to be a bit unwieldy - lots of unstructured data across pictures, post-its, etc. It was also quite difficult to share outputs with a wider group. To get around this, we trialled the use of a piece of software called Touchpoint Dashboard. This application proved to be excellent as a living, shareable repository of mapped journeys - allowing detail and media to be added to illustrate individual interactions. It also allowed for changes to be made quickly without having to edit a diagram in Illustrator for example.
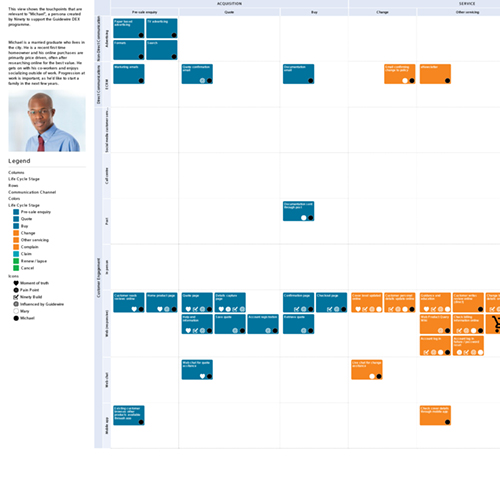
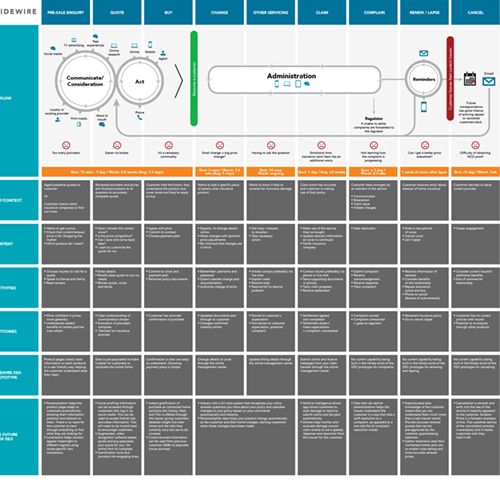
As a way of summarizing and sharing our findings from this Service Design process with management and solcialising it with a wider audience, the last piece I did as part of the strategy-setting was to document a fully-optimized, end-to-end journey in a diagram. This contained a lifecycle diagram and a summation of all of the main considerations from the Service Design phase.
What Were The Outcomes?
There were a number of significant outcomes from this Service Design phase. First and foremost this work had focused the scope of work for the application effectively - instead of some nebulous, undocumented shared thinking, we now had a living document that contained direction and decisions. The outputs also helped to achieve strategic alignment on an organizational level, and promoted understanding about direction. Documenting the optimized journeys crucially gave rise to technical discussions about how analytics should be encorporated, how these coud be used for things like service personalization, and what third party partnerships we should leverage for integrations.
Personally, some of the of the outputs and lessons learned served as a basis for a planning document I subsequently wrote for structured design delivery on the project. Facilitating the workshops also allowed me reflect on how important the collaborative design process is - everyone being able to "have their say" allows for ideas to come out that otherwise might never see the light of day.
Client
Software Product House
Techniques
Customer Lifecycle mapping, Journey mapping, Cross-Channel views, User Scenario mapping, Storyboarding, Touchpoint inventory, User Stories, Workshopping
Technologies
Adobe Illustrator, Touchpoint Dashboard